
This article was published in China Science Daily (2026-07-31, p. 4, Culture), adapted from an earlier lecture at the Sichuan Fine Arts Institute, with a small amount of AI polishing. The illustration was also drawn by me with GPT, though the newspaper credited it to the Sichuan Fine Arts Institute.
Editor’s note
The French thinker Bruno Latour examined the working methods of scientists from an anthropologist’s perspective, arguing that through drawing, tabulating, photographing, measuring, numbering, printing, and registering, scientists gradually transform things in the world that are originally scattered, fluid, bulky, and mutually incomparable into traces on paper. He called this “inscription.” Layer upon layer of inscriptions eventually form numbers and formulas, and this is what underpinned the success of modern science.
People have learned the face of the world from numbers and formulas, but excessive inscription does not help genuine perception, because the roots of science are always sunk in the rich and sensuous lifeworld.
The author of this essay proposes a counterpart concept, “reverse inscription,” which re-expands scientific knowledge that has been compressed by images, formulas, classifications, and texts. This kind of visual design, unfolded in a specific way, can both satisfy the fidelity demanded by layer-upon-layer inscription and awaken the viewer’s sensory understanding.
How is modern science possible? Common answers to this question include the awakening of rationalism, the discovery of methodology, or appeals to changes in economics and institutions. But the French thinker Bruno Latour found such explanations too grand, and too dependent on certain binary oppositions: reason and obscurantism, right and wrong, freedom and despotism, and so on. Latour was not denying that the rise of modern science stemmed from some revolutionary changes; rather, he tried to locate the causes on a more microscopic and concrete level—entering the “site” like an anthropologist and seeing exactly how scientists use their hands and eyes.
Latour’s discovery is also wonderfully simple, and arises from the traces on paper made and handled by modern scientists. They draw, tabulate, photograph, measure, number, and register, manipulating charts, maps, star catalogs, curves, photographs, and instrument readings. Latour lumps all of this together under the term “inscription.” In his 1986 essay “Visualization and Cognition: Drawing Things Together,” he brought these seemingly ordinary actions to center stage: compressing and flattening the scattered, fluid, and dispersed things of the three-dimensional world onto a two-dimensional sheet of paper, making them mobile, preservable, stackable, and comparable. The secret of science, it turns out, is hidden in “paper.”
The world on paper
“Drawing Things Together” is a pun: drawing means “depicting,” while drawing together means “bringing together” or “gathering.” To draw things is to gather them into one place, to bring things from all directions into the studio.
I have no way of moving the coastline of the Americas to Europe, but I can bring back a map of the Americas. From personal experience, how many coastlines can one person walk in a lifetime? To study a world thousands of miles away, one can only rely on inscription to “bring it” to the desk, where it can be stacked, compared, calculated, and “debated.”
Latour called the products of inscription “immutable mobile objects”: things that can be moved anywhere, yet remain internally unchanged in the process. A chart of the Pacific brought back to Versailles preserves the geometric relations of the route without the slightest alteration; a star catalog, printed again and again, still allows the relative positions of the stars to be used for comparison.
This “immutability” is by no means self-evident. The ancients also recorded distant things, from Greek zoological writings to Marco Polo’s travel accounts. But in the case of oral transmission and copying, the more exacting and rigorous the details, the harder they are to preserve accurately; what is heard and seen may be exaggerated or distorted in legend, paintings may be altered in copying, and dry data may be miscopied or simply omitted.
What keeps images faithful as they circulate are two arts: printing and perspective. The significance of perspective is not limited to aesthetic appreciation; it also lies in what Latour calls “optical consistency”: any object—city, landscape, body, or star—can be drawn onto the same sheet of paper according to the same rules of projection, and once drawn, what was adjacent remains adjacent, what was overlapping remains overlapping, and it can still be restored according to the rules. With such consistency, things from afar can be brought back, scaled, superimposed, and reassembled without loss. Later came new technologies such as specimen preparation and photography, but their basic principles were also derived from printing and perspective.
But gathering alone is not enough. There are simply too many things in the world that can be inscribed. Darwin brought back from the Beagle so many specimens and notes that they nearly pushed him out of his own house. So inscription also has another feature: it can be layered and nested, inscription upon inscription. Latour calls this the “cascade” of inscription, that is, using less and less paper. One extracts curves from raw records, equations from curves, and a parameter from equations. It is precisely this chain of successive simplifications that allows science to mobilize the whole world with just a few symbols, turning laboratories, observatories, and cartographic offices into “centers of calculation.”
The artistic foundations of science
Perspective came from the explorations of Renaissance artists. In the early fifteenth century, the Florentine architect Brunelleschi conducted his famous perspective experiment; in 1435, the Italian painter Alberti, in On Painting, compared the picture plane to “a window,” turning painting into geometric projection. These painters were not merely craftsmen with brushes; they argued like philosophers about what is true, and explored and refined methods of attaining truth like scientists.
Printing, meanwhile, made images into a carrier of knowledge for the first time. The age of manuscripts was not without illustrations; on the contrary, because manuscripts were precious, they were often accompanied by sumptuous images. But in those days the people who wrote books, copied books, and painted pictures were often three separate groups who knew nothing of one another: the copyist would leave blank spaces, and the illustrator would fill them in according to a few cryptic prompts. Yet text and image were basically unrelated; the illustrations were mere decoration, and even the same illustrator could not necessarily ensure that every image was identical, let alone a book that might be redrawn repeatedly in the course of transmission and copying.
Printing changed everything. The painter needed only to make one image, and woodcuts and copperplates could reproduce it exactly in millions of copies; images could thus carry knowledge and be subjected to scrutiny. In 1543, the Belgian anatomist Vesalius’s On the Fabric of the Human Body pushed this new technology to its limit. In traditional anatomy lectures, the professor sat high on the lectern reading aloud from Galen’s ancient books, while the barber below wielded the knife, the corpse seeming to be merely a footnote to the text. Vesalius turned the whole scene upside down: he personally wielded the knife, and worked closely with painters trained in Titian’s workshop, so that the gracefully posed “muscle men” could stand in Italian landscapes, each muscle fully extended. The historian of science Nankawa Sachiko reminds us that these images are by no means decorative additions to the text. They are themselves arguments; remove the images, and the book is incomplete.
Images do not merely record observation; they also train observation. In 1609, the Englishman Harriot pointed a telescope at the moon before Galileo did, but the sketches he made were only a few floating blotches; a few months later, Galileo, trained in drawing, read mountains and valleys from the same patterns of light and shadow, and was able to record his discovery accurately in sketches and spread it across Europe through printing. Galileo’s mathematical tutor came from an art academy.
In fact, a telescope cannot see three-dimensional images, so how did Galileo discover the moon’s mountains from a flat image? Precisely because he believed that the telescope could maintain “optical consistency,” and thus could be used to reconstruct them in the same way one would draw the mountains nearby.
Inscription and reverse inscription
The astronomical revolution took place before the invention of the telescope. From Copernicus to Tycho and Kepler, their observational tools were no qualitatively more advanced than those of the ancients. What was truly advanced was their inscription tools: with the help of printing, observational data for the first time had standardized, regulated, and faithful records. Tycho turned the fleeting starry sky into row upon row of stackable and comparable numerical tables with unprecedented precision; when Kepler took over these data, he found that however he arranged things, Mars’s orbit differed from a perfect circle by eight arcminutes. In antiquity, such an error would have counted as perfect, but Kepler insisted on the matter because he trusted the consistency of the tables. Kepler did not make new observations; rather, he continued working on the results inscribed by Tycho, and ultimately transformed Tycho’s data into elliptical curves and concise formulas.
The story of natural history is the same. Linnaeus himself remained in Uppsala year after year, relying on his disciples, known as “apostles,” to collect specimens for him all over the world; he regarded his collection as a miniature of the “world museum,” using a classification table that could be expanded without limit to gather life on the globe into the page—order on paper was established before the order of nature.
Geology in the nineteenth century went one step further, producing images for an ancient past that no one witnessed: stratigraphic cross-sections allowed rock layers scattered across different places to be superimposed and compared, while reconstructions of prehistoric landscapes laid out hundreds of millions of years of time in a scene that could be taken in at a glance. Only by first imagining a prehistoric world entirely different from the present could one then speak of extinction and evolution—the new concept of “deep time” was almost brought into being ex nihilo by visualization.
The same story is hidden in statistics. Nightingale is remembered by history not only because of her devotion as the “Lady with the Lamp,” but also because she did something beautifully visual. The casualty data from the Crimean War had originally sat in dense tables that officials could not understand and did not want to read.
In 1858, Nightingale arranged the causes of death by month into a layered fan-like “rose diagram,” making it immediately obvious to anyone that soldiers were dying in large numbers from poor sanitary conditions rather than from bullets and shells. The chart magnified the impact of the data and directly drove sanitary reform in the British army. Interestingly, the direction of movement here quietly reversed: once the data had been inscribed as abstract numbers, ordinary people could no longer make sense of them, so the numbers had to be drawn again into a shape that could be felt—when inscription goes too far, it calls forth a reverse movement.
On this basis, the author proposes a counterpart concept—“reverse inscription.” Reverse inscription does not mean abolishing inscription, nor returning to an unmediated original thing; rather, through objects, models, instruments, interactive devices, exhibition lines, labels, and digital interfaces, it reorganizes knowledge into an experiential structure that can be seen, touched, operated, traced, and discussed together.
Take a science museum as an example: it can use space to re-expand scientific knowledge that has already been compressed by images, formulas, classifications, and texts. It can restore a law that lies in a textbook as a real or reconstructed steam engine; it can restore a species reduced to a classificatory sign into specimens with different postures and traces upon them; it can restore a history of discovery compressed into a conclusion into an exhibition route that one can walk through step by step.
The direction of movement emphasized by Latour is contraction—three-dimensional to two-dimensional, concrete to abstract, scattered to gathered; the direction of movement of the museum, by contrast, is spatial re-expansion—it rearranges what inscription has folded up, placing it once again within a site of shared experience.
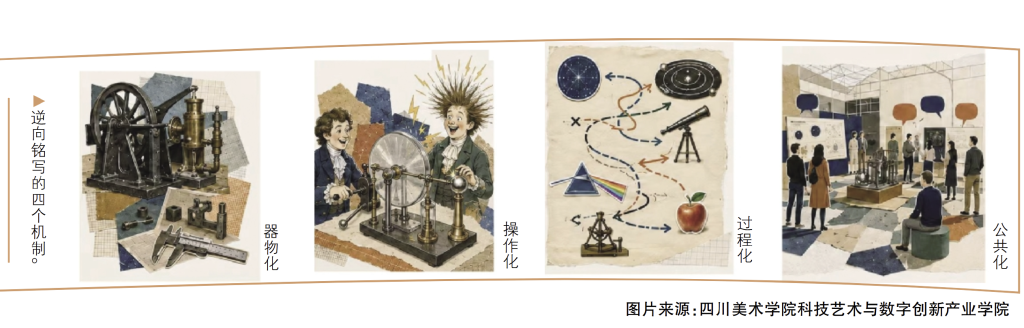
This reverse inscription includes at least four mechanisms. First, objectification: re-expanding the abstract into objects with scale, weight, material, and traces. Second, operationalization: re-expanding symbols into actions that can be triggered, observed, and repeated. Third, proceduralization: re-expanding conclusions into the sequence of how knowledge came to be. Fourth, publicization: re-expanding the expert-centered space into a place that the public can enter together.
The end product of “inscription” is the “immutable mobile object,” whereas “reverse inscription” in a sense ultimately displays the “mutable immobile object.”
From “gathering” to “displaying”
As for the nature of modern science, the conventional accounts—such as the mathematization of nature and the discovery of mathematical experimental method—can all be explained within the framework of inscription. For the layered process of inscription ultimately produces the flattest, lightest, and most faithful inscription product, which is nothing other than numbers and formulas. Through layer upon layer of inscription, the infinitely rich natural world becomes computable numbers. And through industrial technology, we in turn can continuously “retrieve” rich products from numbers. Our modern life testifies to the success of modern science.
But the “faithfulness” of inscription is never absolute; it must pass through layers of cutting and compression. It is faithful, for example, to learn about a person from an untampered photograph—but if we think that everything about this person can be known from the photograph, then we have gone wildly astray.
We certainly can understand the real face of the world from numbers and formulas, but if we take them to be the whole of the world, then we fall into error. This is precisely what the Austrian philosopher Husserl called the “crisis of European science”: science has forgotten that its roots are always embedded in the rich and sensuous lifeworld.
The example of Nightingale illustrates this point: dry numbers are easier to calculate, but not conducive to perception; the soldiers’ concrete situations behind the numbers are obscured. Of course, if one merely conducts field observations, one may not necessarily arrive at accurate conclusions either; on the battlefield, the enemy’s guns and shells always seem more terrifying than the sanitary conditions of the camp.
So the best mode of presentation is neither the flattest inscription nor the most primitive observation, but a re-expansion of visual design in a particular way—the meaning of the “rose diagram” lies precisely here: it both satisfies consistency, or faithfulness, within the layered process of inscription, and effectively awakens the viewer’s sensuous understanding.
Not only the public and decision-makers need sensuous understanding; scientists need it as well. Scientific research has never truly become a purely computational activity. Even pure mathematicians rely on intuitive imagination and perceptible auxiliary lines. Einstein benefited from the “graphic thinking” and intuitive pedagogy he received at the Aarau Canton School in Switzerland; the discovery of relativity came from a thought experiment that appealed to intuition, the “chasing light” experiment. Chemists and biologists rely even more on palpable models: Watson and Crick discovered the DNA double helix precisely by assembling a metal model with their own hands.
With the development of modern science, on the one hand science’s influence on the world has become ever broader and more profound; on the other hand, it has become increasingly difficult for ordinary people and even scientists to obtain sensuous understanding of science’s frontier developments. Scientists mostly know their own narrow specialties; once they cross fields or even disciplines, their understanding may not be any more astute than that of ordinary people.
The “computing center” is still running efficiently, but if we forget what these data actually mean and merely keep pushing their precision a few more decimal places to the right, that has no meaning at all.
Therefore, we need “rose diagrams” and operational models even more. We need to “unfold” scientific data compressed to the utmost, to “display” it in space, and to provide public, decision-makers, and interdisciplinary researchers with sensuous interfaces—thereby promoting public understanding and ethical oversight, and also fostering interdisciplinary and disruptive research.
The wave of artificial intelligence (AI) makes this issue even more urgent. AI is accelerating the production of papers, and it is also reading papers on people’s behalf. When both writing and reading can be handed over to machines, what is left for human beings? Probably taste, imagination, value judgment, and empathy—the ability to judge what problems are interesting and what directions are worth pursuing. Traditionally, all of these have been classified under “the sensuous.”
Perhaps the main interface through which future scientists participate in knowledge production will shift from flat and abstract papers to a more sensuous, more spatial “curatorial space”—humans will be responsible for feeling, machines for calculation.
During the Renaissance, artists pursued “truth,” and art provided science with inscription techniques and the principle of “optical consistency.” Yet contemporary art has long since undergone a new turn: from the pursuit of precise realism in classical art, Impressionism began to try to express emotion and feeling; Cubism thoroughly overturned the principles of perspective, presenting the multiplicity of viewpoints; installation art and performance art place even greater emphasis on spatiality and participation… If contemporary art is a rebellion against and reconstruction of classical art, then could its new pursuits and new principles once again be integrated into the course of science? This is precisely why art and science need to meet again, to explore new ways for scientists to use the eye and the hand.
Translated from the Chinese original with AI assistance. The original text is authoritative.